Web Analytics Overview
Web analytics lets you track and watch key measures for your website easily. It is different from product analytics because it's simpler and more direct, making it great for marketers, web site maintainers, or anyone familiar with tools like Google Analytics.
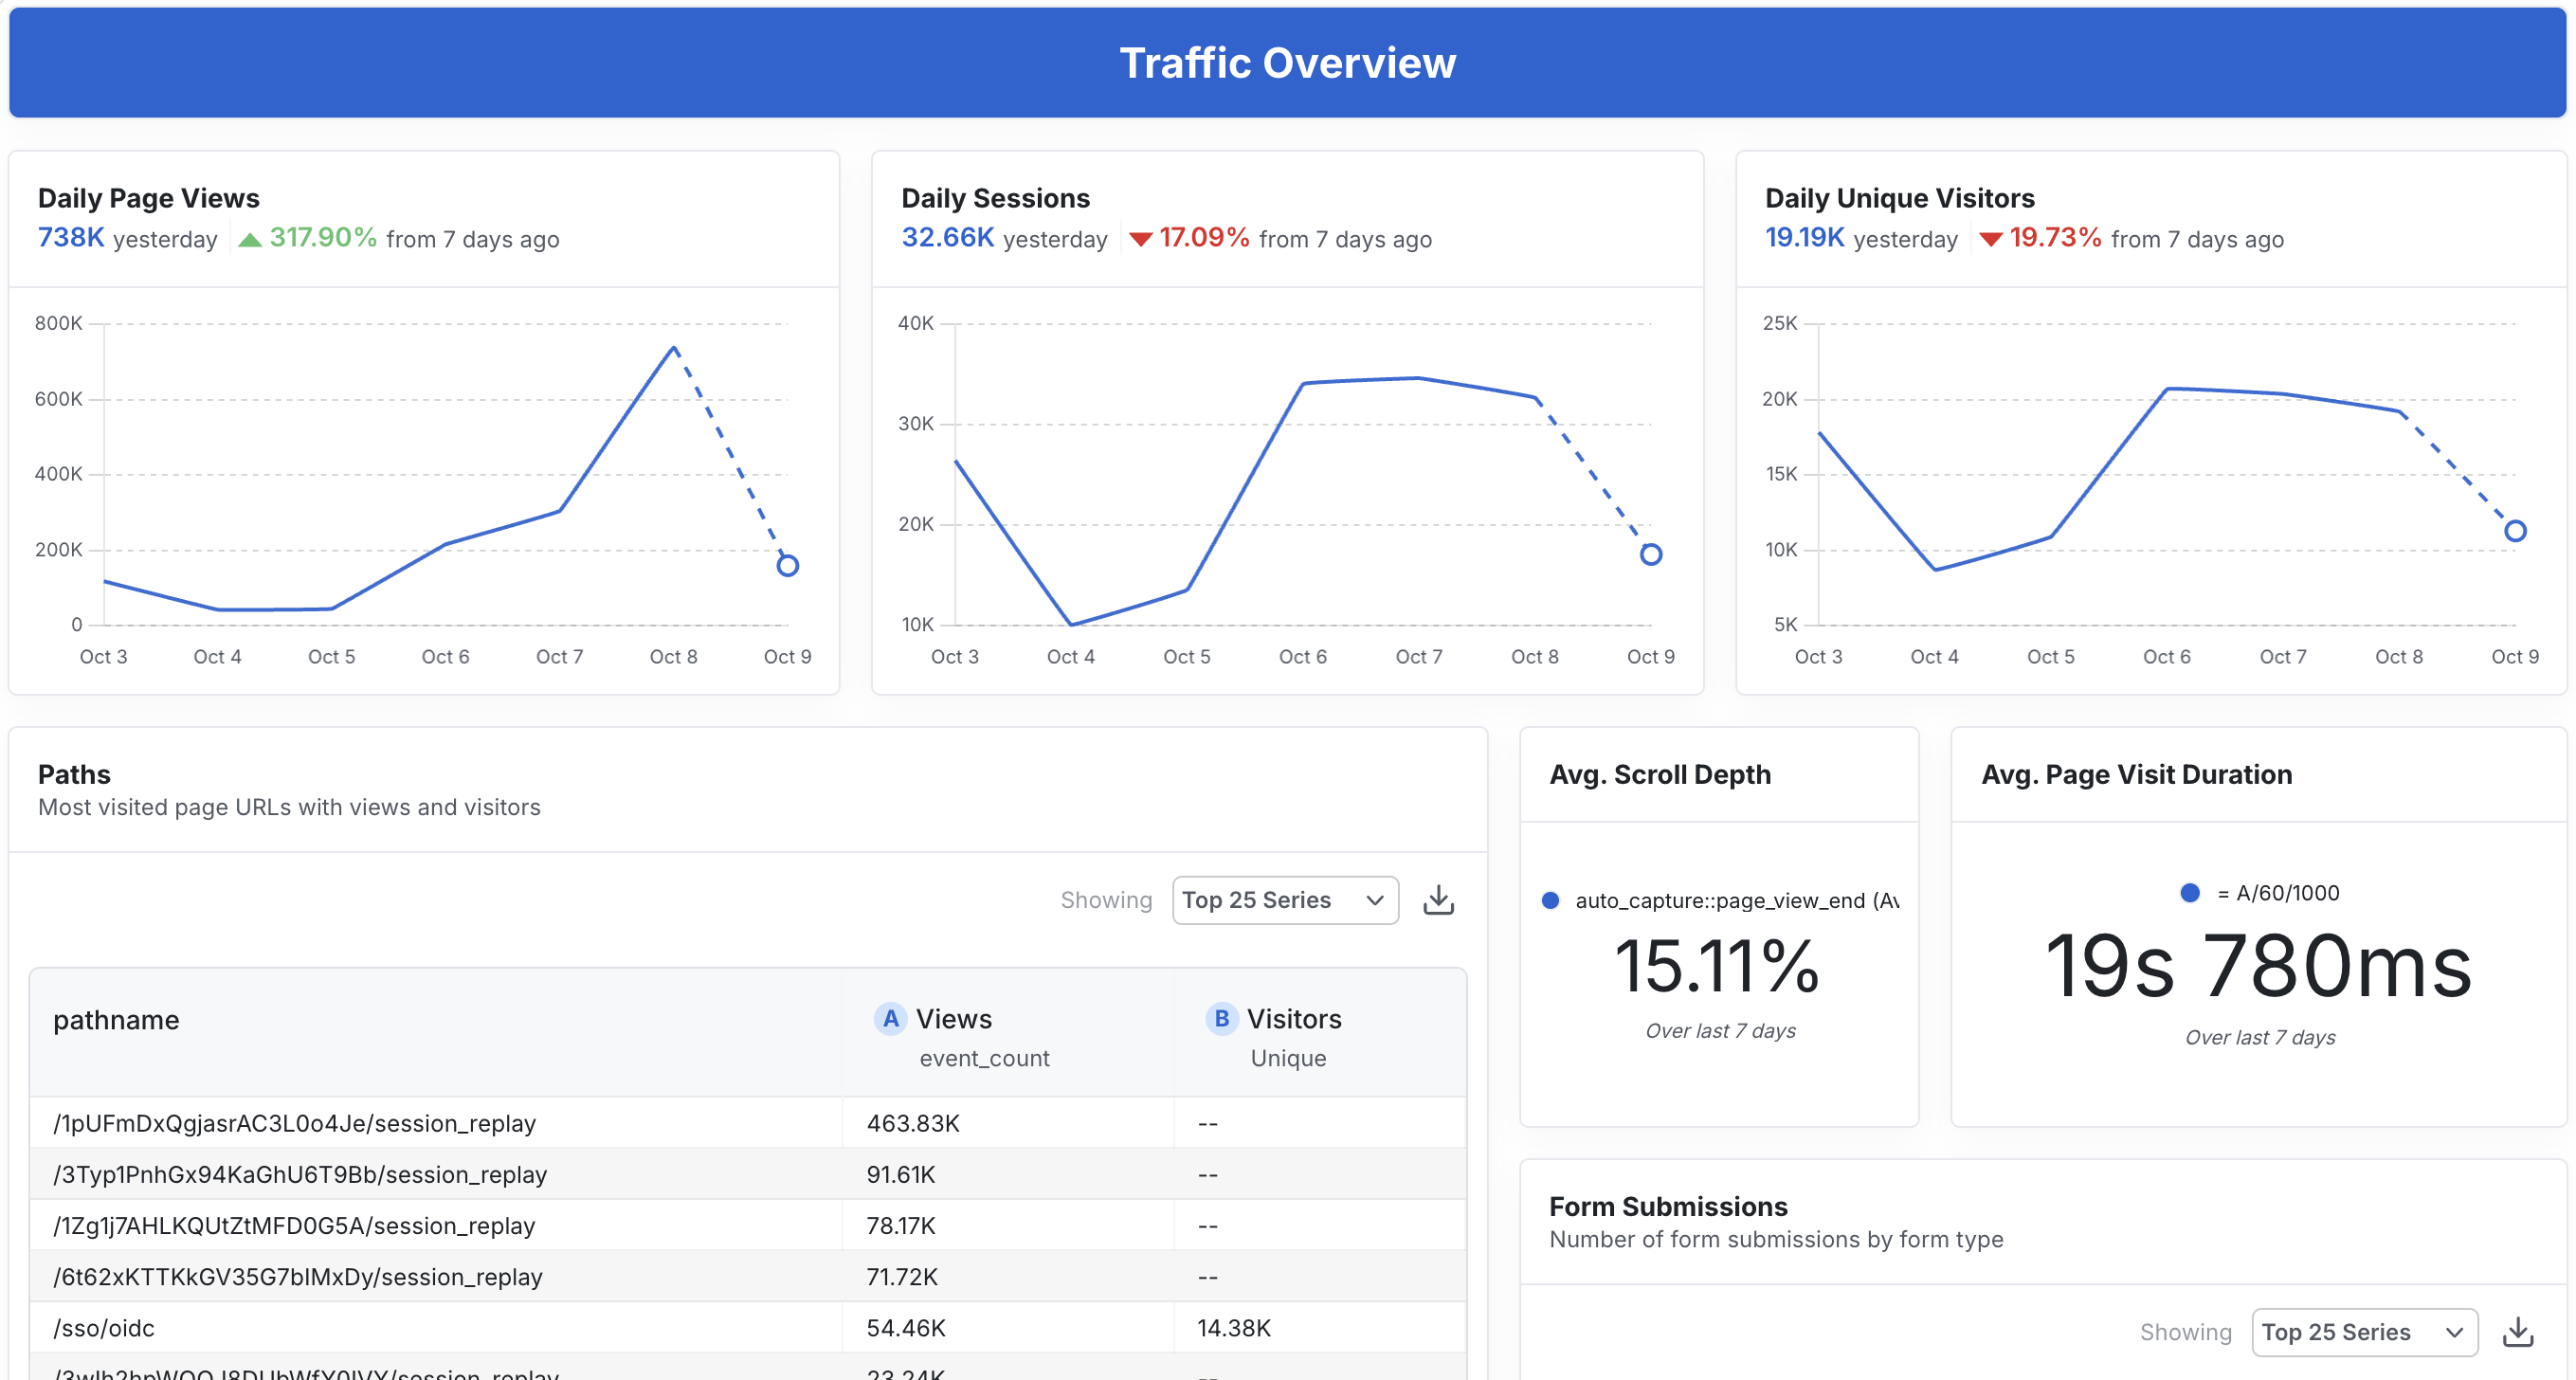
With Web Analytics and Statsig Dashboards you can easily gather insights such as number of visitors, views, sessions, how long sessions last, error rates, usage journey, and more.
You can see the events flowing in your metrics page once you add web analytics to your application: https://console.statsig.com/metrics/events
Getting Started
Follow these simple steps to get started with Web Analytics.
Option 1: HTML Script Installation
The simplest way to get started is by adding a single script tag to your website:
<script src="https://cdn.jsdelivr.net/npm/@statsig/js-client@3/build/statsig-js-client+session-replay+web-analytics.min.js?apikey=[YOUR_CLIENT_KEY]"></script>
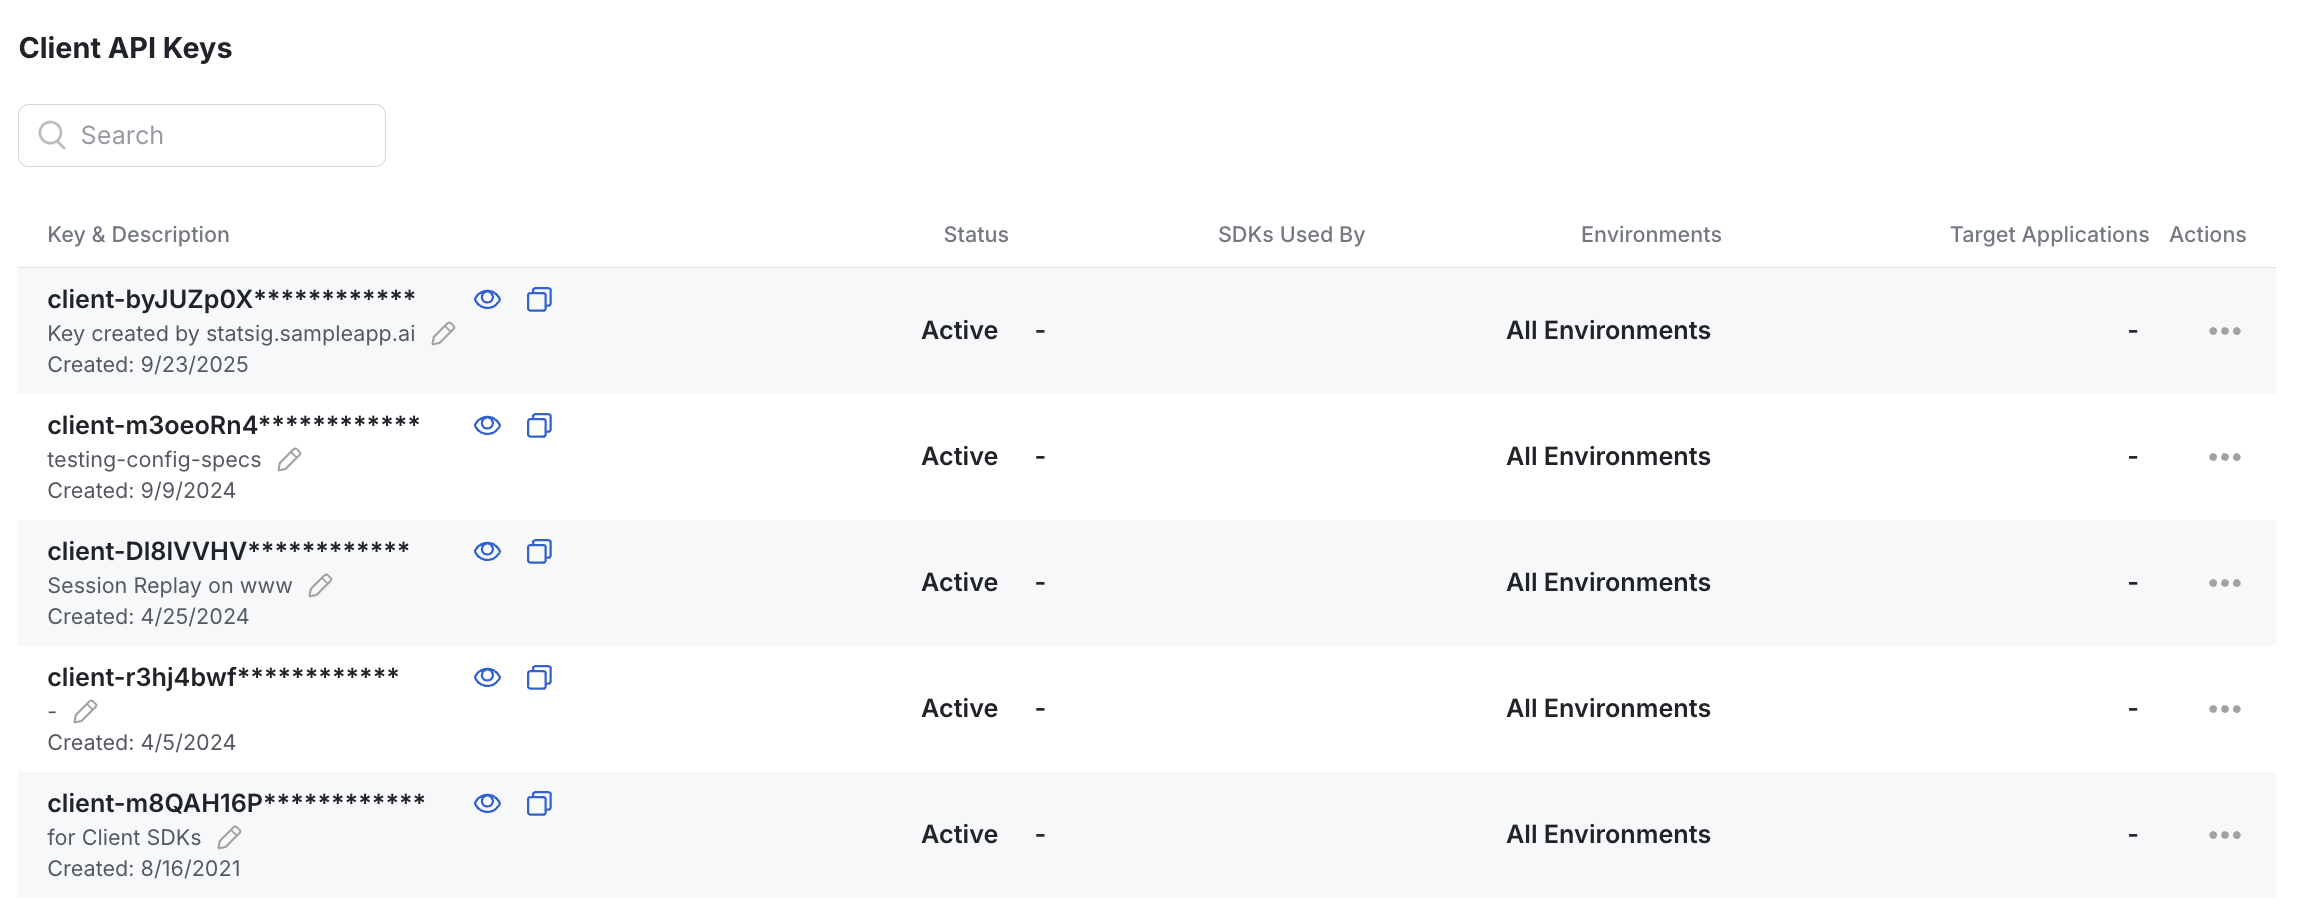
Get YOUR_CLIENT_KEY from Project Settings -> Keys & Environments. Reveal the Client API Key, copy, and paste it over the [YOUR_CLIENT_KEY] in the snippet above.
Option 2: HTML Script with Advanced Control
For more control over initialization and configuration, you can manually initialize the Statsig client:
<script src="https://cdn.jsdelivr.net/npm/@statsig/js-client@3/build/statsig-js-client+session-replay+web-analytics.min.js"></script>
<script>
  const { StatsigClient, StatsigAutoCapturePlugin, StatsigSessionReplayPlugin } = window.Statsig;

  const client = new StatsigClient(
    'YOUR_CLIENT_KEY',       // put your client sdk key here - "client-XXXX"
    { userID: 'optional' },  // set a userID here if you have one
    { plugins: [
      new StatsigAutoCapturePlugin(),
      new StatsigSessionReplayPlugin()
    ]}
  );

  client.initializeAsync().catch((err) => console.error(err));
</script>
Option 3: JavaScript Client SDK (React Bindings)
If using javascript client SDK or other frameworks, you can use the the corresponding SDK with the autocapture plugin (JS, React, Angular, etc.):
import * as React from 'react';

import { StatsigProvider } from '@statsig/react-bindings';
import { StatsigAutoCapturePlugin } from '@statsig/web-analytics';

  return (
    <StatsigProvider
      sdkKey={YOUR_CLIENT_KEY}
      user={{ userID: 'a-user' }}
      loadingComponent={
        <div>Loading...</div>
      }
      options={{ plugins: [ new StatsigAutoCapturePlugin() ] }}>
      <div>Hello</div>
    </StatsigProvider>
  );
Autocaptured Events
Statsig Web Analytics automatically captures the following events without any additional code:
Page Navigation Events
auto_capture::page_view- Triggered when a user navigates to a new page. Includes page URL, query parameters, referrer information, and metadata.auto_capture::page_view_end- Triggered when a user leaves a page. Includes engagement metrics like scroll depth, time on page, and whether the exit was due to inactivity.
User Interaction Events
auto_capture::click- Captures all click events with target element information, coordinates, and page context.auto_capture::rage_click- Detects rapid repeated clicks in the same area, often indicating user frustration.auto_capture::dead_click- Identifies clicks that don't result in any page changes or navigation, potentially indicating broken functionality.auto_capture::form_submit- Captures form submission events with form metadata.auto_capture::copy- Tracks when users copy text from your page, including the selected text content.
Technical Performance Events
auto_capture::error- Automatically captures JavaScript errors with stack traces, error messages, and context.auto_capture::web_vitals- Captures Core Web Vitals metrics (see the Web Vitals Events section below).auto_capture::performance- Collects page load performance metrics including load times, DOM interactive time, and network transfer data. (deprecated, useauto_capture::web_vitalsinstead)
Session Events
auto_capture::session_start- Marks the beginning of a new user session.
Console Logging (Disabled by Default)
statsig::log_line- Captures console log output when explicitly enabled. This event is disabled by default and must be configured to activate.
For details on how to enable console log autocapture, see Console Log Capture Configuration.
Event Filtering and Console Configuration
Disabling Events via Console
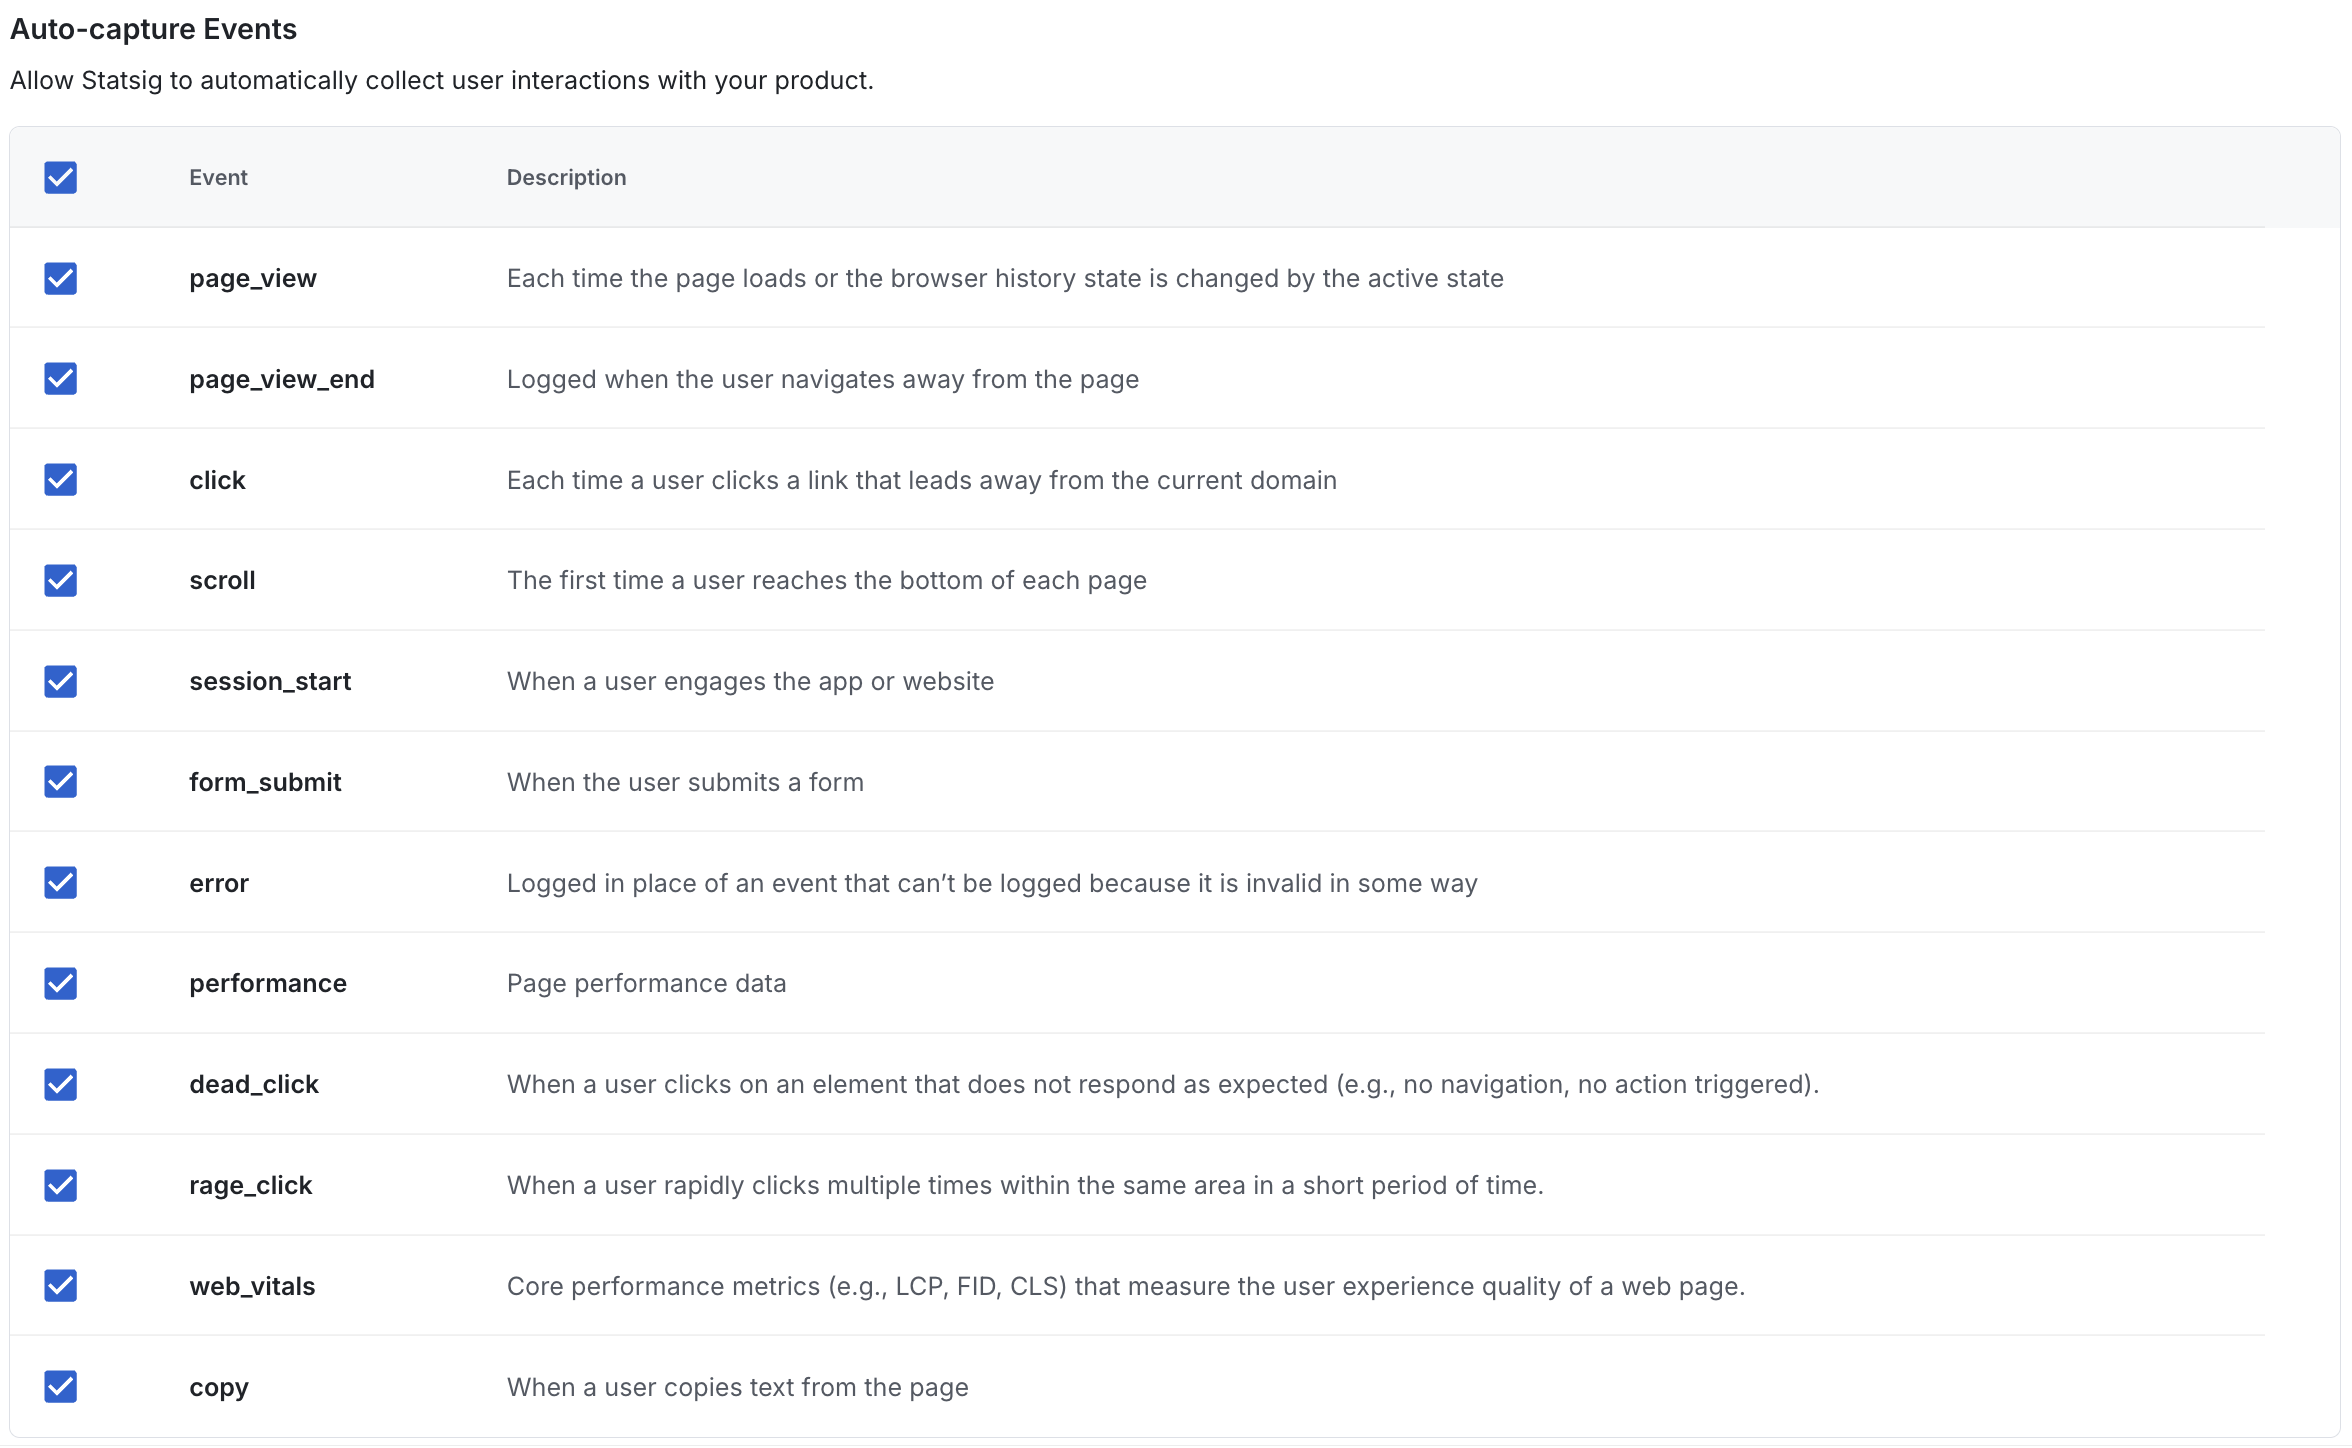
You can disable specific autocapture events from the Statsig console under Project Settings > Analytics & Session Replay:
Programmatic Event Filtering
For more granular control, you can filter events programmatically using a custom filter function:
const client = new StatsigClient(
  'YOUR_CLIENT_KEY',
  { userID: 'optional' },
  { plugins: [
    new StatsigAutoCapturePlugin({
      eventFilterFunc: (event) => {
        // Filter out events from admin pages
        if (event.metadata.pageUrl &&
            event.metadata.pageUrl.includes('/admin/')) {
          return false;
        }
        return true;
      }
    })
  ]}
);
Console Log Capture Configuration
Console log capture is disabled by default but can be enabled with the following configuration:
const client = new StatsigClient(
  'YOUR_CLIENT_KEY',
  { userID: 'optional' },
  { plugins: [
    new StatsigAutoCapturePlugin({
      consoleLogAutoCaptureSettings: {
        enabled: true,
        logLevel: 'warn'
      }
    })
  ]}
);
Web Vitals Events
Statsig automatically captures Core Web Vitals metrics that are essential for measuring user experience and SEO performance:
The Four Core Web Vitals
-
CLS (Cumulative Layout Shift) - Measures visual stability by tracking unexpected layout shifts during page load. Lower scores indicate better user experience.
-
FCP (First Contentful Paint) - Measures loading performance by tracking when the first text or image is painted on the screen. Faster FCP times indicate better perceived performance.
-
LCP (Largest Contentful Paint) - Measures loading performance by tracking when the largest content element becomes visible. This metric correlates strongly with user-perceived load times.
-
TTFB (Time to First Byte) - Measures server response time by tracking how long it takes to receive the first byte of response from the server. This indicates server and network performance.
These metrics are automatically collected and sent as auto_capture::web_vitals events, providing insights into your website's performance and user experience quality.
Single Page Application (SPA) Support
Statsig Web Analytics automatically supports single page applications without any additional configuration. The system intelligently detects route changes through:
Automatic Route Change Detection
- Browser Navigation: Listens for
popstateevents to detect when users use browser back/forward buttons - Programmatic Navigation: Automatically proxies
history.pushStatecalls to detect when your application programmatically navigates to new routes - Automatic Page Views: Triggers new
auto_capture::page_viewevents whenever route changes are detected
This means that modern SPA frameworks like React Router, Vue Router, Angular Router, and others work seamlessly with Statsig Web Analytics without requiring manual page view tracking.
Exploring using Metrics Explorer
In Metrics Explorer, you can dig deeper and explore your events by using complex filters and dimensions. You can then explore your analysis to your dashboard.
More information on using Metrics Explorer like Funnels and Retention is here.
You can see some example autocapture event details here.
Autocapture Settings
The autocapture plugin or manual setup can take an optional options parameter to customize the autocapture settings.
eventFilterFunc:Optional[Callable[[AutoCaptureEvent], bool]]- A function to filter events based on their metadata.consoleLogAutoCaptureSettings:Optional[ConsoleLogAutoCaptureSettings]- An object to configure console log capture.
consoleLogAutoCaptureSettings:
enabled:Optional[bool]- A boolean to enable or disable console log capture.logLevel:Optional[str]- A string to set the minimum log level for console log capture.sampleRate:Optional[float]- A number to set the sample rate for console log capture. (0-1)
eventFilterFunc:
event:AutoCaptureEvent- The event object that is being captured.return:bool- A boolean to return true to capture the event or false to ignore it.